Customer Cockpit
The Customer Cockpit is designed to allow operators to quickly find a particular customer, and view all the associated personal and billing details.
The Cockpit consists of a “Quick Search” column on the left, with the rest of the screen being used to display the various detail sections for the selected Customer.
Quick Search
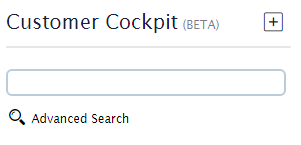
When you enter the Cockpit for the first time, you will only see a search box, a welcome message (with basic tips), the  button (for adding a new Customer) and an
  link (which will take you to the original Customer search screen, now called “Advanced Search - Customers”)
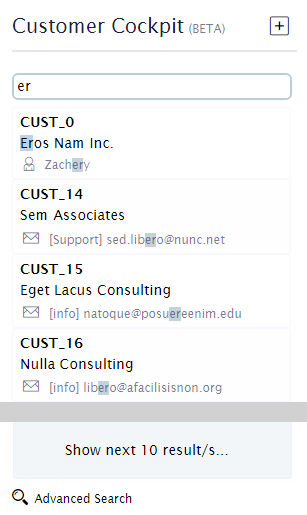
Simply start typing in the box to find a Customer. You may enter any part of the Customer Name or Customer Code, as well as the name or phone number of the contact person. You can also enter one of the associated email addresses.
As you type, the system will immediately search for results and display them below the search box. Each result will always display the Customer Code and Name, and if one of the other fields matched your search text, it will also be indicated. The matching portion of the text will be highlighted for easier identification.
In the example on the right, the user has searched for “er”, and several results have been returned.The matching text is highlighted, and you’ll notice that various customers with different matching fields have been found. The following icons indicate the matching field, if appropriate:
 Contact Name was matched
 Contact Phone number was matched
 One of the customer’s email addresses matched
The search will only fetch up to 10 results at a time. If more matching customers are still available, you have the option to add the next set of results to the existing list by clicking the light blue box at the end of the list. This box indicates the size of the next set (which will be a maximum of 10 results at a time). This process can be repeated until you find the correct customer, or there are no more matching results.
Clicking on the appropriate customer will load all of his details to the right of the search panel. —–
Overview
In the center of the screen, at the top, we show the selected Customer’s Name and Code (in this example, ”Eros Nam Inc.” and “CUST_0” respectively). Beneath this, the customer’s invoicing cycle is described.
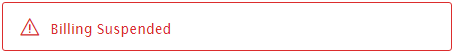
If the customer’s billing has been suspended, a warning is shown to indicate this.
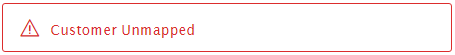
Similarly, if a customer has not been assigned to a valid Customer Cluster, a suitable warning is shown. Clicking on this warning will take you to the Edit Customer screen.
Price Plan Highlights
The Price Plan Highlights block is a mechanism to highlight certain pricing conditions that might be pertinent to your Customer Service operators. These are typically pricing rules that are either exceptions to the normal pricing model, or have significant effect on the invoice and you wish for these effects to be highlighted to operators. Common examples would be country/region specific Tax rates, Discounts applicable to this customer, or special overriding rules specific to this customer.
This section will only show rules that might apply to the selected customer, and currently valid. Administrators may flag any of the pricing rules to “Show In Price Plan”, when Adding or Editing a Price Rule.
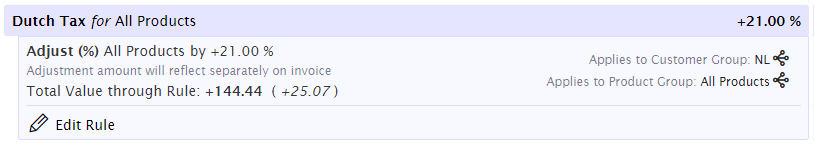
The rule (in its collapsed form) displays the name, the product or product group it applies to, and if appropriate, the value associated to the rule. Negative values are shown in red.
Clicking on a highlighted rule will expand the row, and show some of the specific details, as in the example above. Details include which clusters this rule applies to, the operating values, and an option to edit the rule.
Billing History
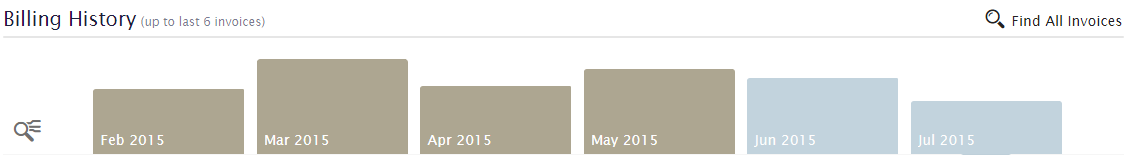
The Billing History section contains 3 main components. The first of these is the Invoice Chart (pictured above), which shows a simple chart reflecting up to the last 6 invoices for the selected customer. Each invoice indicates the period. The total value of the invoice, relative to the other 5, is represented by its height. If an invoice appears in the light blue colour, it means it is still open for change (i.e., it has not been Approved or Closed etc). Darker invoices are approved or closed etc.
Directly beneath the chart, the screen will show either the Invoice View, or the Invoice Analysis. Clicking on the  button (pictured above) will switch to the Invoice Analysis, while clicking on the
  button will switch to the Invoice View. Clicking on any of the invoices in the chart will load

that period’s information to the Invoice View and Invoice Analysis views (see below). The currently selected invoice will be indicated with a small arrow underneath: 
Hovering over an invoice, you will notice a small  icon appear. Clicking on this will show a popup screen where you are able to view, in realtime, any of the Transformations that are applicable to this invoice. You are also able to view the Invoice Details on this screen, and download any existing (and up to date) transformations that have been generated and stored. Read more about the Invoice Viewer…
Invoice View
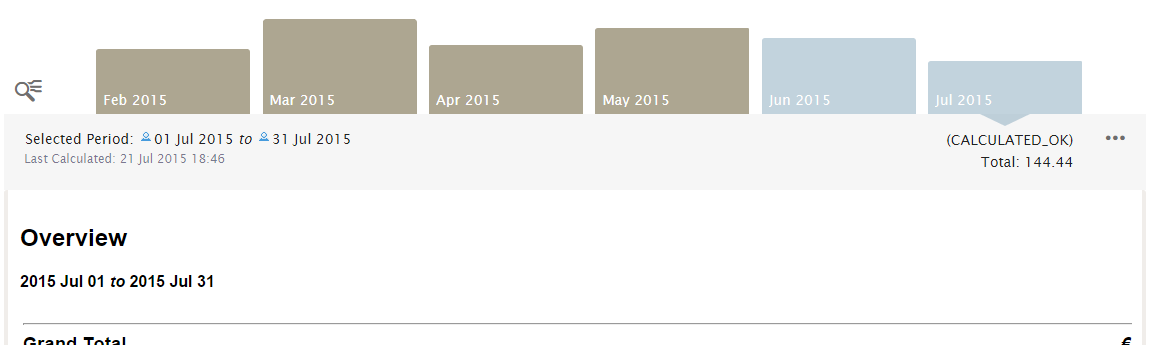
This is the default view for a Customer in the Cockpit. Because every business is different, CloudBilling allows you to choose what data is most important for your operators to see first when loading a customer in the Cockpit. This is achieved by making use of the Invoice Transformation Templates. The Invoice View will use the first template that has been marked as “Default View” (see Invoice Transformations & Results).
In the example below, we see that the July 2015 invoice period has been selected. Basic information about the invoice is shown in the grey header, and the transformation output is displayed below it. Clicking on the button (top right corner of the header) will bring up the Invoice Viewer Popup.
Invoice Analysis
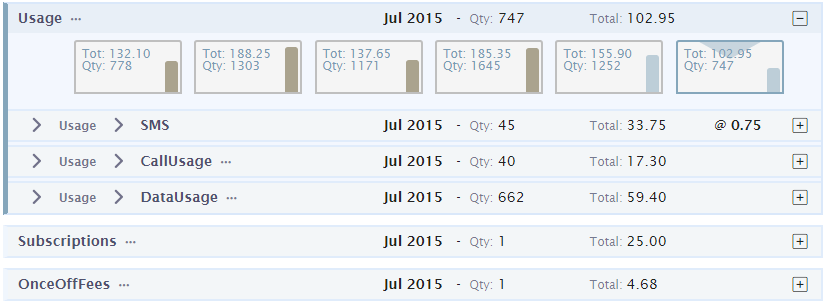
The Invoice Analysis mode allows you to drill down through your products (as they pertain to the selected Customer), and view the usage and billing for each one, across up to the last 6 periods simultaneously. This gives you easy and fast insight into the behaviour of any particular product or product group, for the current customer. The data for this analysis is drawn from summarised calculation information (generated during the continuous billing process), and organised by the Product Clusters (specifically, clusters that have been flagged to be included in the Product Plan. See Add / Edit Product Clusters)
By default, all Products are collapsed on first view, with only the headers of the top level products shown. The header includes the following important product information, from left to right:
- Product Description
- with a small ellipsis if there are children beneath it.
- Currently Selected Period (selected by clicking on the Invoice Chart above.
- Total Quantity for the selected period
- Calculated Total Value for the selected period
- If a Unit Price can be determined at this product level (generally, when it is not a Product Group/Category), this is displayed too.
- an indicator of whether or not the row is currently expanded.
Clicking on a row will expand to show the (up to) 6 last periods (each showing the total Quantity, Value, and Unit Price if determinable).
Hovering the mouse over the row, or over the header product names, will highlight related items, to make it easier to track how the product you are currently examining fits into your business’s broader product offering.
In the example above, the user has expanded the “Usage” product group, revealing “SMS”, “CallUsage”, and “DataUsage” as product sub categories (each showing their respective totals in the headers). The user has then expanded the “CallUsage” product, to find that this is further divided into Local and International products.
At each product level, we see the Quantity and Value for the currently selected period in the header.
For any expanded product, the same values for the last 6 periods are shown in the small “invoice cards”, with the currently selected period highlighted with a small . (In the examples above, July 2015 is selected)
Finally, if the user expands the “SMS” product, and then selects the July 2015 invoice card, he sees the information below. In this example, because there is a Unit Price rule against the “SMS” product cluster, the system is able to show this to the user (i.e. “@ 0.75”)
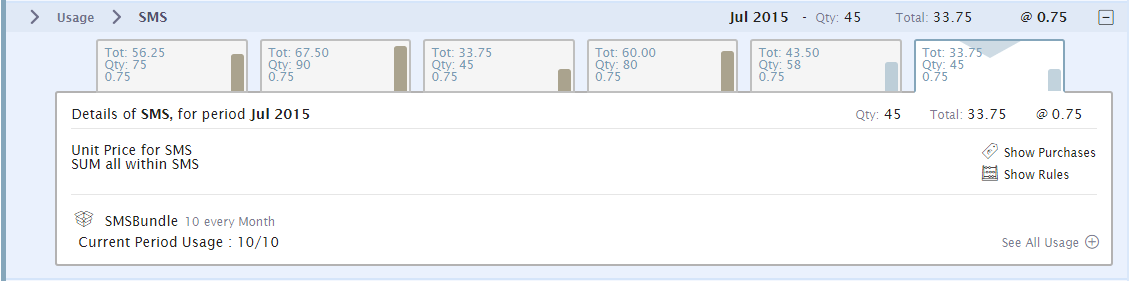
For the selected Invoice, important details include:
- Total Quantity
- Total Calculated Value
- Unit Price if determinable
- a simple list of rules that apply to this customer, selected period, and specific product
- if a validity restriction exists on a rule, it is displayed here too)
- links to find all Purchases applicable to this customer, product, and invoice combination
- links to find all Rules applicable to this customer, product, and invoice combination
- Extra information:
- In the case of Ladder rules, the ladder rule details (steps etc) will be displayed here, collapsed by default.
- As in the example above, when a Customer Bundle exists that might be applicable to this product, its details and usage for each period, up until the current period, are shown here (collapsed by default).
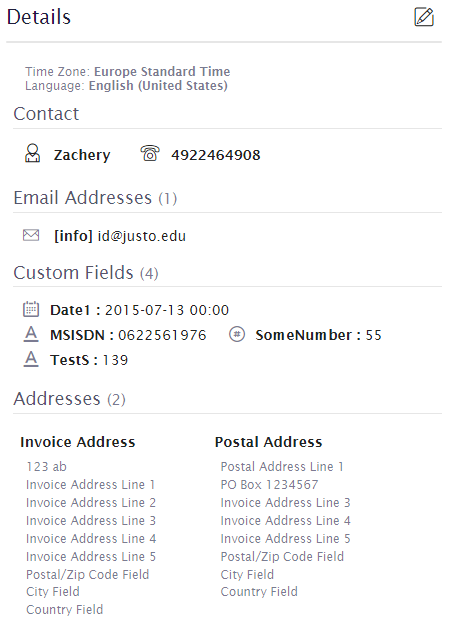
Customer Details
A quick-access overview of the selected customer’s details are shown on the far right of the screen. The following information is made available:
- Time zone and Language
- Contact person and phone number
- Hidden if not captured
- Email Addresses
- each address is in the following format:
- {[Key] emailaddress}
- The “DisplayName” for that email is visible in a tooltip when the mouse is hovered over the email address.
- A count of how many emails exist, is shown in the header.
- Custom Fields
- This is a simple combination of the various metadata captured for the customer. Each custom field is in the following format:
- {Key: Value}
- For each field, a small icon illustrates the type of data:
 Text
Text Numeric
 Datetime
- This section is collapsible (by clicking on the “Custom Fields” header)
- A count of how many custom fields exist. is shown in the header.
- This is a simple combination of the various metadata captured for the customer. Each custom field is in the following format:
- Addresses
- All addresses captured for this customer are displayed in “address cards” here, with the Name field as a heading (in bold), and all address lines beneath it.
- This section is collapsible (by clicking on the “Addresses” header)
- A count of how many addresses exist, is shown in the header.
If you wish to make changes to the currently selected customer, you can click on the  button, which will take you to the Edit Customer screen.